SAP Security Notes 2018: Lessons Learned and a Look to What’s Ahead in 2019

2019 has just begun, but the year is already looking busy in the ERP security world. We’ve decided to put together this blog post as a two-part analysis: the Onapsis Research Labs’ recently completed wrap-up of the SAP Security Notes for 2018 and the World Economic Forum’s Global Risks Report for 2019. What is the relationship between these two things? According to WEF report, based on the responses from nearly one thousand decision makers, cyberattacks are one of the highest risks in 2019 having both a high likelihood of occurrence and a high impact to organizations. Cybersecurity will be a main topic for every risk-conscious manager and definitely a growing issue for every big company in the world. As the leaders in business-critical application security, we expect to have even more ERP security analyses for you this year. An analysis of what happened with SAP patches during 2018 is a good way to start!
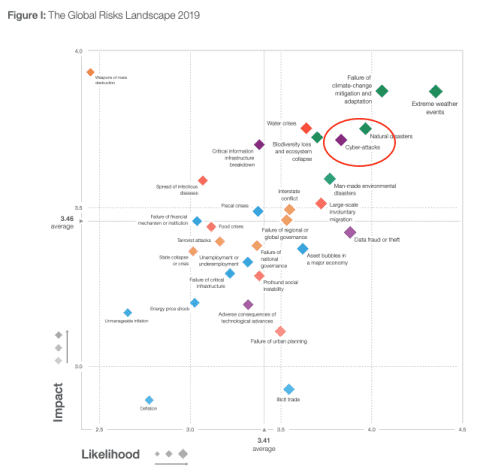
This is the second year in a row that cyberattack risk ranks among the Top 5 risks presented in the report (it didn’t appear at all in the previous three years). For 2019 Risk Mapping it appears only behind “Data Fraud or Theft”, which is related to cybersecurity, and three natural-related risks.
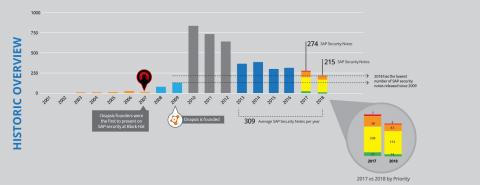
There is no doubt cybersecurity has been and will continue to be a big deal for everybody this year and keeping your ERP applications secure is a big part of how to protect your organization against both cyberattacks and other types of data fraud and theft. Moving forward to the main topic of this blog post, we have been publishing our monthly analysis of SAP Security Notes for three years now. We started in 2017 when we created and published a history graph to illustrate the evolution of SAP Security Notes. Last year, we highlighted that SAP was entering a stability phase, averaging 328 notes per year from 2012 to 2017. This year, we saw a reduction in published SAP Security Notes, continuing the stability phase.
Download the full 2018 SAP Security Notes review infographic.
But are we in a stability phase or decrease phase? Analyzing the data, it seems it is a bit of both. The amount of notes has undoubtedly shrank in the last three years, with an over 30% decrease from 2016 to 2018. However, additional analysis from the team indicates that this decrease does not have a significant impact in the way SAP security should be handled.
The average of published SAP Notes is now 299. This is a significant increase from the average of 52 from 2005 to 2009 and significantly smaller than the 735 during the 2009 to 2011 period. If you are responsible for patching vulnerabilities, there is a big difference patching 50 versus 700 a year. However, when we compare the most recent years, there is not much difference in the amount of those vulnerabilities: 299, 317, 328. If the numbers continue to decline, you may want to consider changes in how you allocate resources to handle SAP security, but currently that’s not the case. Of course, this suggestion is based on looking at the number of vulnerabilities alone. There are many other factors to consider, including evaluating people, processes and technology allocations for your security. It seems we still are in a stability phase and based on other details we can confirm that.
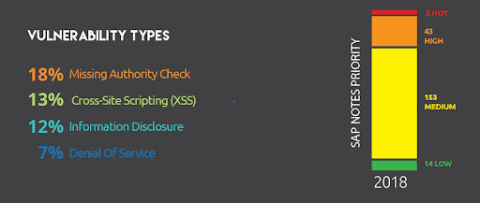
The number of critical notes is slightly higher from 45 in 2017 (38 High Priority + 7 HotNews) to 48 this year (43 High Priority + 5 HotNews). Based on feedback from customers, High Priority and HotNews notes are usually treated with a higher priority, being the only ones installed individually (instead of support packages or bigger updates) or have a shorter SLA for installation. In both cases, knowing that the decrease of notes was mostly based on the amount of Medium Priority notes that SAP published this year, it could be a big mistake to correlate this reduction with a risk reduction. We recommend that you install Medium Priority notes; however, usually High Priority and HotNews have priority as the negative impact is higher, should they be successfully exploited.
The most common vulnerabilities remain even, having a Top 3 as we saw in 2016. Missing Authority Check is back as the most common type with 18% of the published notes, leaving Cross-Site Scripting (XSS) bugs in second place with 13% (these were #1 in 2017). Information Disclosure (12%) and Denial Of Service (7%), completes third and fourth positions.
We stand true to this advice provided in the 2017 review blog post:
“What does this mean for corporate security? It is an opportunity. Stable numbers are not good news by themselves. No matter how many vulnerabilities are being patched, an attacker only needs one to perform a successful exploitation. In that sense, there are no security implications if a year has 50 more or 50 less vulnerabilities. Nevertheless, stability should be good for internal processes. It is easier to define a team, time allocation, priorities and processes, if you know what is coming. Stability is not good, per se. It is just an opportunity to better define SAP security inside your company, to make it quicker to patch and to reduce your risk of exposure.”
As the need for ERP security continues to grow and SAP security continues to mature, now is the time to evaluate your strategy. How are you evolving the protection of your business-critical SAP applications? Risks may be increasing, but there are also more opportunities to stay protected. It is just a matter of evaluating your strategy and continuing to improve. Stay tuned to our ERP security blog throughout 2019, where we will keep bringing you the latest in SAP security and trends from the industry.